Performance Plus Demo
Performance Plus is a real-time in-game diagnostics HUD that tells you exactly what is hurting your frame rate and how to fix it.
Stop switching between the Unity Profiler, Frame Debugger, and Stats window.
Performance Plus puts everything you need in one always visible overlay. The moment your scene starts struggling, you'll see exactly why.
WHAT IT MONITORS
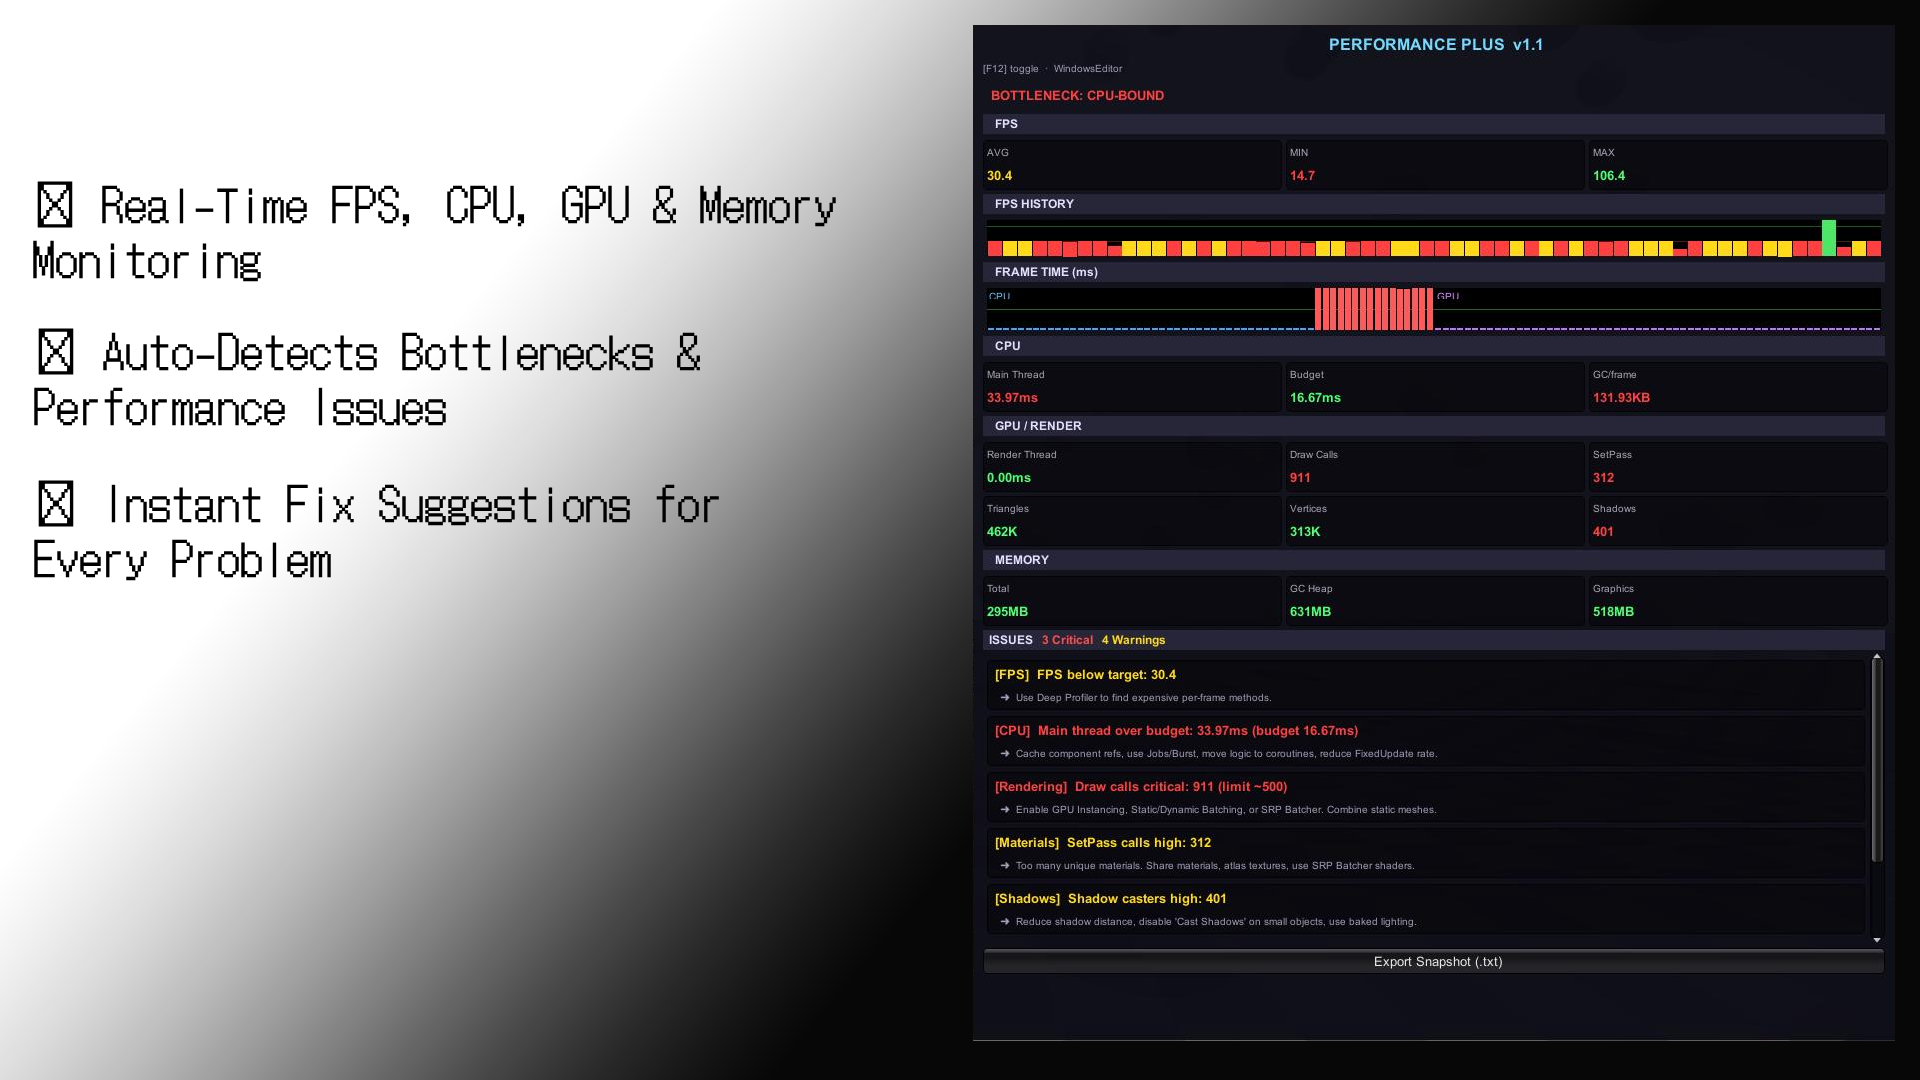
- FPS (average, minimum, maximum) with a live sparkline graph
- CPU main thread timing vs your frame budget
- GPU render thread timing
- Draw calls, SetPass calls, triangle & vertex counts
- Shadow caster count
- GC allocations per frame (heap pressure detection)
- Total, GC heap, and graphics memory usage
AUTO BOTTLENECK DETECTION
Performance Plus automatically classifies your session as CPU-Bound, GPU-Bound, Memory Pressure, or Balanced — so you know exactly where to focus your optimization work.
ACTIONABLE ISSUE LIST
Every metric that crosses a threshold generates a fix card with a plain-English suggestion. Not just "draw calls are high" — but "Enable GPU Instancing or use the SRP Batcher. Check batching breaks in the Frame Debugger." Real advice, not just numbers.
BUILT FOR ALL PLATFORMS
Switch between threshold presets with one click in the Inspector.
FEATURES AT A GLANCE
- Real-time FPS, CPU, GPU, memory & render stats
- Auto bottleneck classifier (CPU / GPU / Memory / Balanced)
- Issue detection with severity badges (🔴 Critical, 🟡 Warning, 🟢 OK)
- FPS sparkline graph with target & critical reference lines
- ScriptableObject thresholds fully customizable per platform
- PC, Mobile & Console presets built-in
- Custom Inspector with one-click preset buttons
- Export snapshot to .txt report
- Configurable toggle key, panel anchor & width
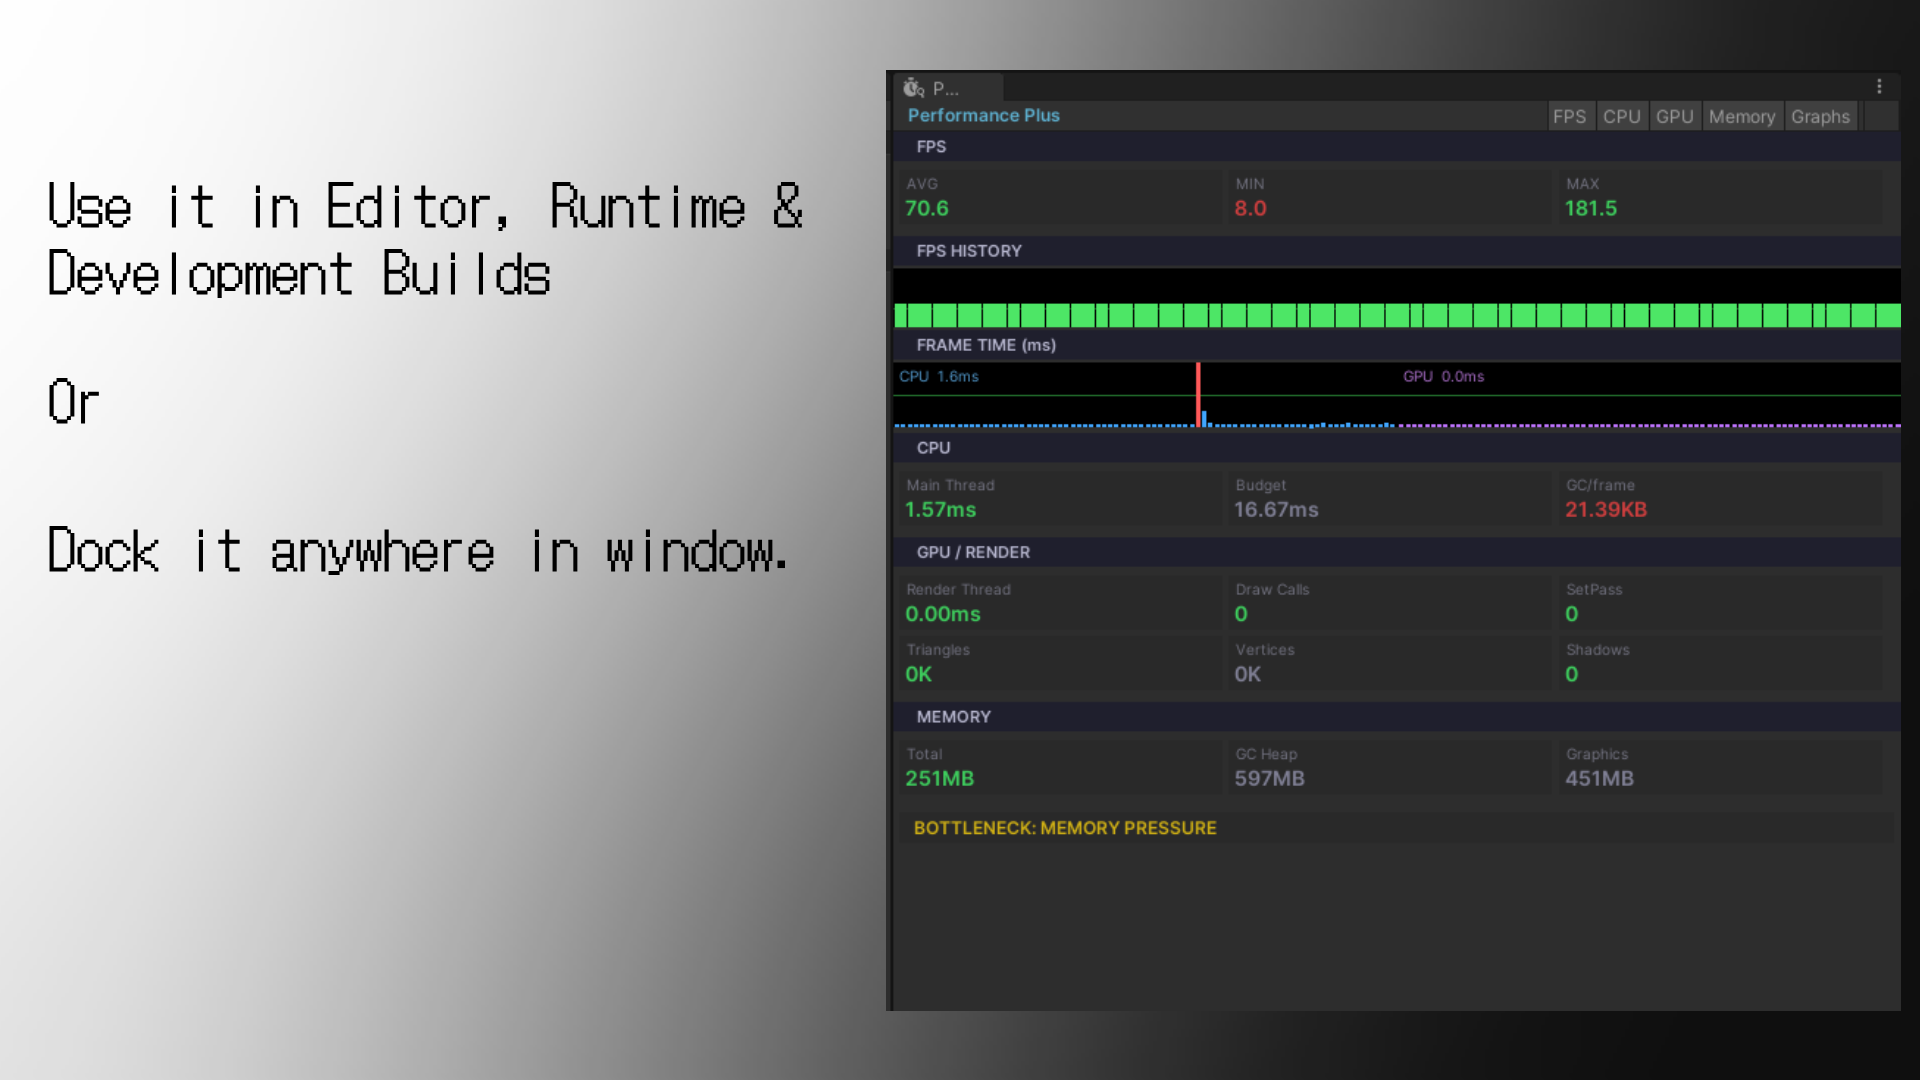
- Works in Editor Play Mode and Development Builds
- Zero dependencies